How to read the Analytics dashboard: filtering by QR Codes, folders or tags, the Overview stat cards, the geography and engagement panels, and exporting.
The Analytics dashboard (/analytics) is where you see how your QR Codes are performing — scan volume, audience, geography, and engagement — across any combination of QR Codes, pages, folders, tags, categories, or users.
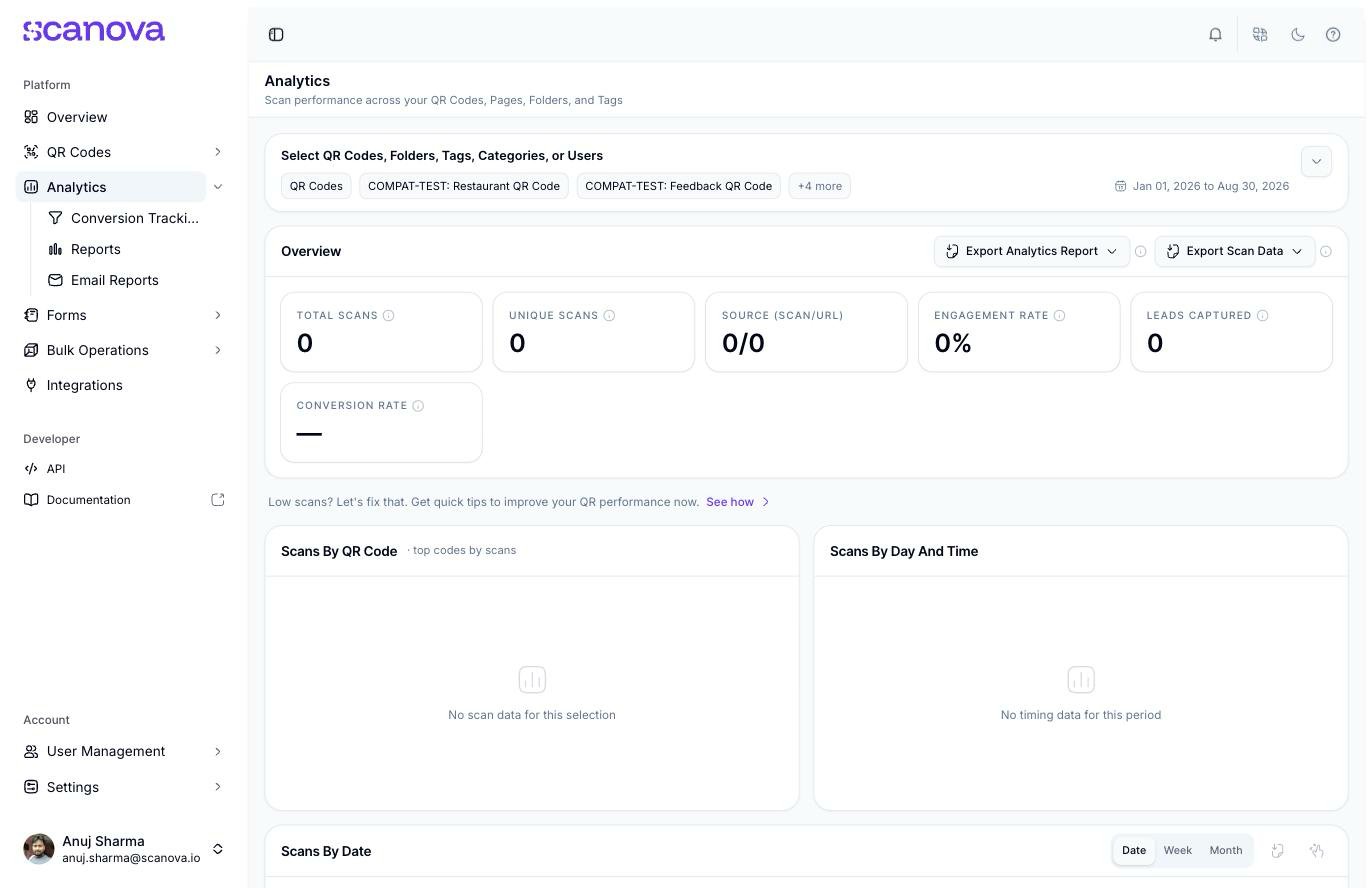
The Analytics dashboard, filtered to all QR Codes with an empty (zero-scan) result set
Above the charts, a filter bar lets you scope the whole dashboard:
Entity type — switch between QR Codes, Folders, Tags, Categories, or Users
Entity selector — a searchable multi-select for the chosen entity type, with a Select all shortcut
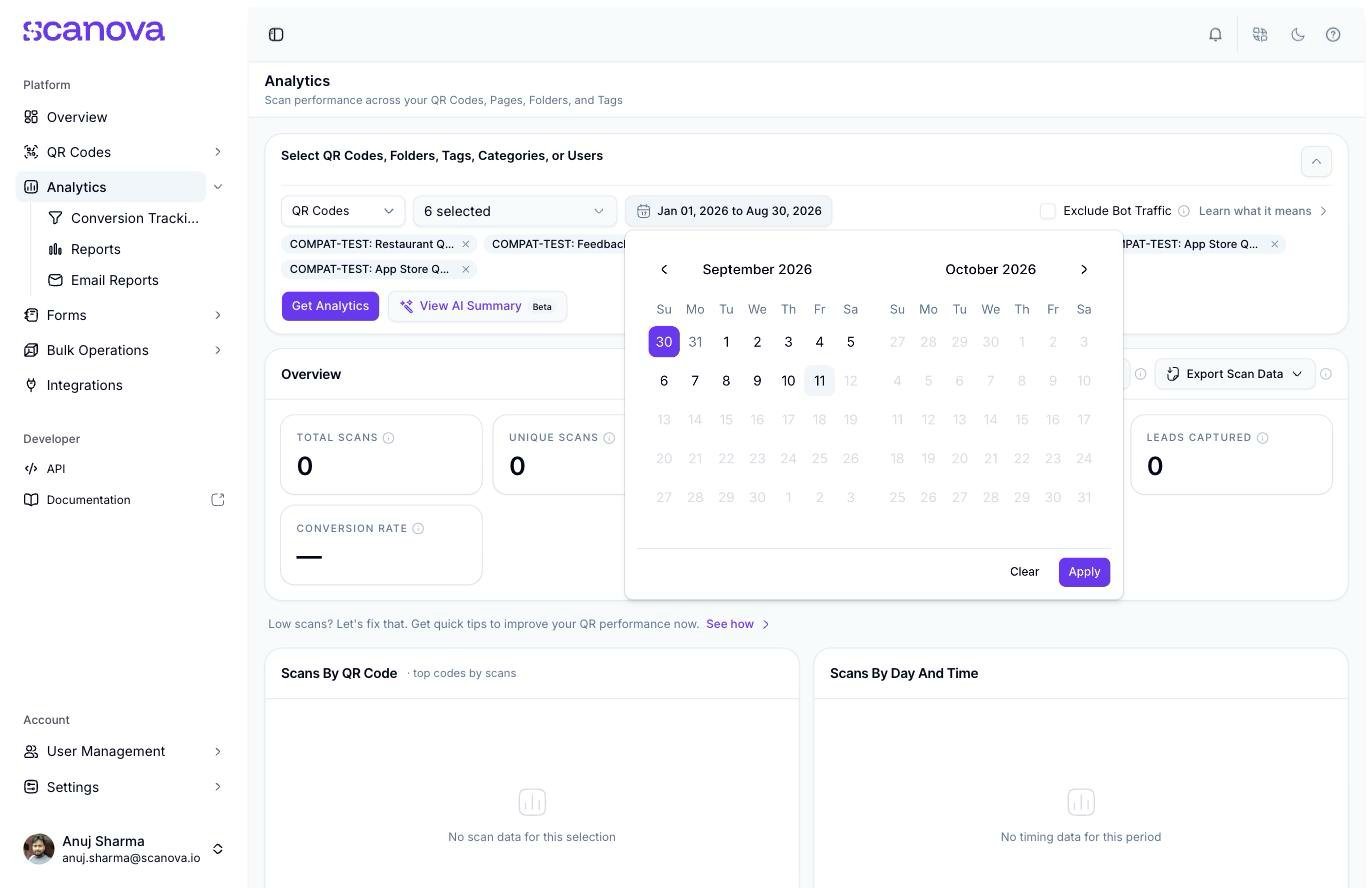
Date range — click the date field to open a two-month calendar picker. Pick a start and end date and select Apply, or Clear to reset.
Exclude Bot Traffic — a checkbox that filters out non-human scans, with a Learn what it means link, explained in Bot scans
The date-range picker on the Analytics dashboard
After making your selections, select Get Analytics to load the data. A View AI Summary button (marked Beta) is also available once you have a selection.
The dashboard doesn’t load any data until you select at least one entity and select Get Analytics — it starts on an empty “Get started by selecting…” state.
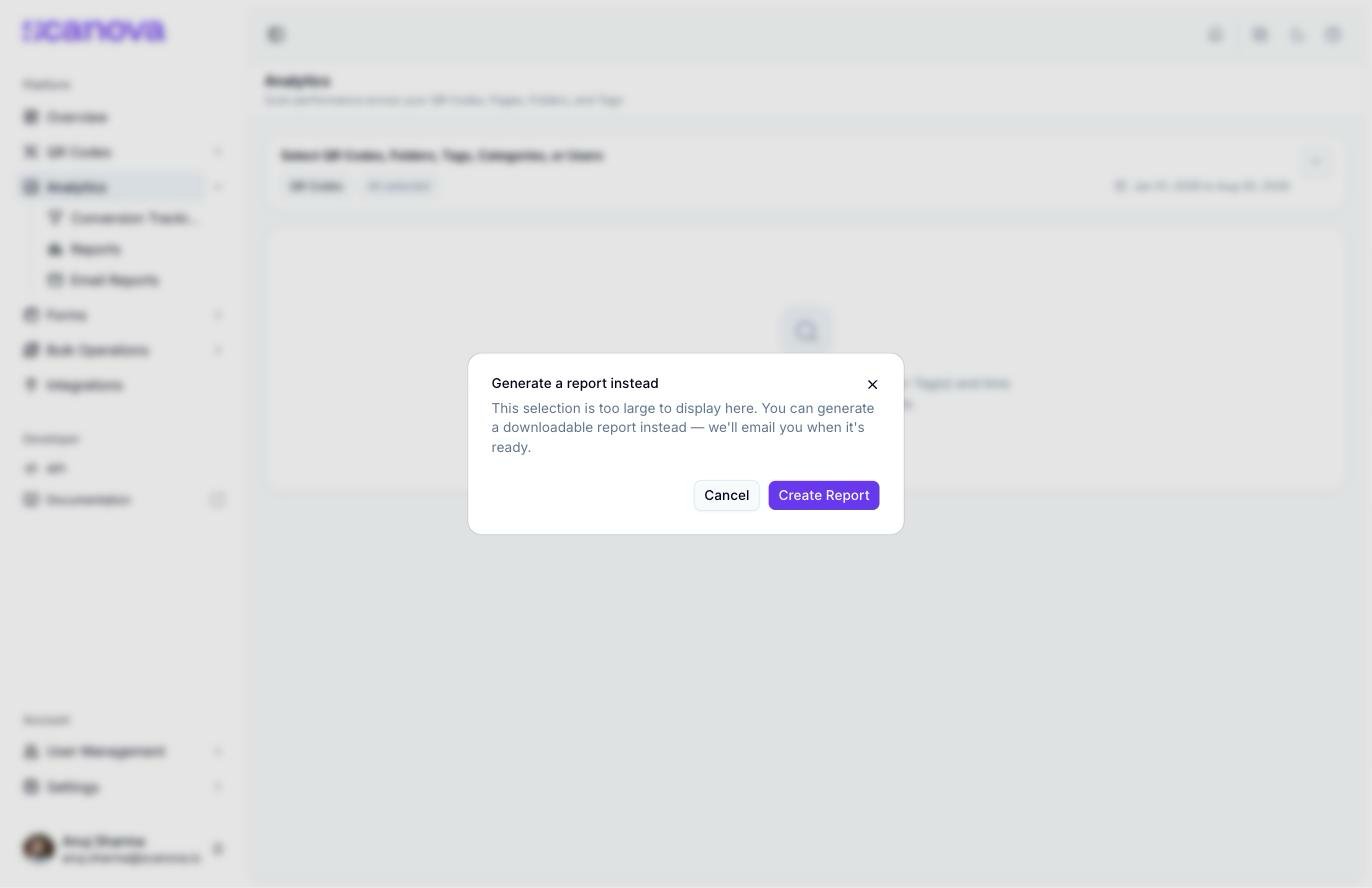
Selecting too many entities and/or too wide a date range (for example, every QR Code on the account across several months) doesn’t load the dashboard at all — a “Generate a report instead” dialog appears instead, reading “This selection is too large to display here. You can generate a downloadable report instead — we’ll email you when it’s ready,” with Cancel and Create Report buttons. Narrow your selection (fewer entities or a shorter date range) if you want the live dashboard, or use Create Report to fall back to an async Reports job for a large selection.
The dialog shown when a dashboard selection is too large to render live
The Overview row shows six headline metrics for the selected entities and date range: Total Scans, Unique Scans, Source (Scan/URL), Engagement Rate, Leads Captured, and Conversion Rate. Source (Scan/URL) breaks down how visitors arrived — via an actual QR Code scan versus the underlying short URL opened directly — shown as a ratio (e.g. “0/0”). Each card shows a trend indicator (percentage change against the previous period) once there’s data to compare, and each has an info tooltip explaining how it’s calculated.
When the selection has few or no scans, a “Low scans? Let’s fix that. Get quick tips to improve your QR performance now.” banner appears below the Overview cards, with a See how link.
Next to the Overview heading are two export menus:
Export Analytics Report — a one-off visual export of the current view as PDF, XLS, or XLSX
Export Scan Data — a one-off export of the underlying scan records as CSV, XLS, or XLSX
These two menus export the dashboard’s current view instantly. If you need a report you can revisit later, or one delivered on a recurring schedule, see Reports and Email reports instead.
Below the Overview cards, the dashboard breaks scan activity down into focused panels:
Scans By QR Code — your top-scanning codes for the period
Scans By Day And Time — a day-of-week × time-of-day heatmap of when scans happen
Scans By Date — a trend chart with Date / Week / Month granularity toggles and a percentage change badge versus the previous period
Scans By Country — a world map of scan volume by country. Scanova notes that this map is for representational purposes only.
Recommended next moves — short, auto-generated suggestions based on the period’s data (for example, flagging a drop in scans and suggesting you refresh creatives), each tagged with a priority level. With nothing to flag, it shows “No standout actions this period — metrics look balanced.”
Audience & geography and Who is scanning — audience breakdowns. Audience & geography toggles between By region, New vs returning, and Scan source views; Who is scanning toggles between Device, Browser, OS, and Handset views
Which QR Codes are winning — a ranked comparison of your QR Codes for the period
What users did — on-page event actions, shown as rings representing each event’s share of total scans
Engagement by QR Code — per-code engagement detail
Where conversions are lost — a drop-off view for entities with conversion tracking configured
Lead Form Data — data from any lead-capture forms attached to your QR Codes, with table and grid view toggles
Every panel has its own empty state (for example, “No scan data yet for this period”) when there’s nothing to show for the current filter and date range.
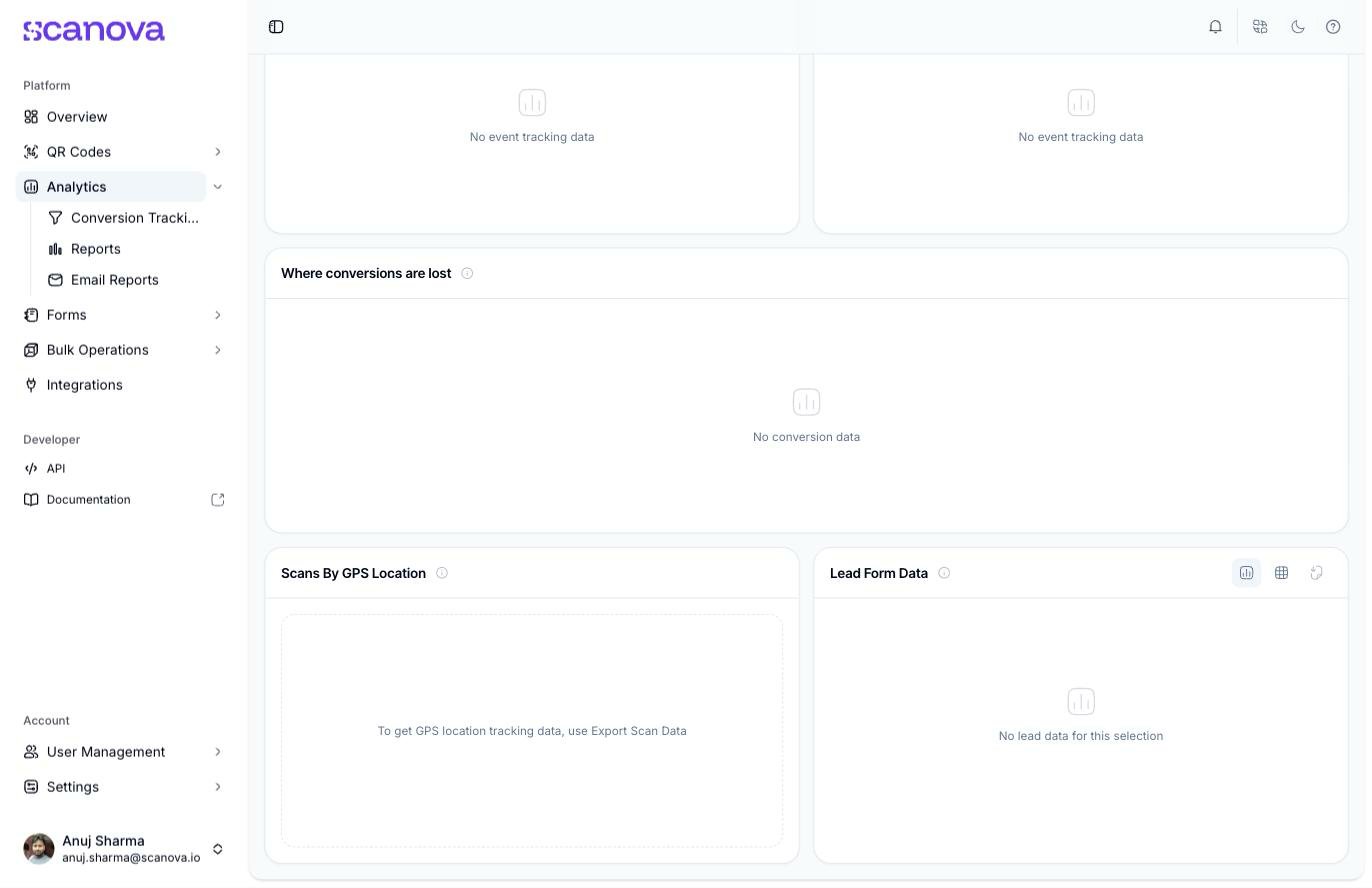
The Scans By GPS Location panel with no GPS data available
Scans By GPS Location is a dedicated panel for precise, device-reported scan coordinates (distinct from the country-level map above). On an account with no GPS-tagged scans, it doesn’t render a map — instead it shows a message pointing you to Export Scan Data, since GPS coordinates are only meaningful once you have data to plot. If your QR Codes have collected high-accuracy location scans, expect this panel to render those as points on a map instead.
The Conversion Tracking entry in the Analytics section of the sidebar (/analytics/conversion) is a separate area for defining conversion funnels and events on top of your scan data. It isn’t covered on this page — see Conversion Tracking for full setup and usage documentation.