Generating one-off scan analytics reports you can download later, how the request queue works, and when to use a report instead of the live dashboard.
Reports (/analytics/reports) generates point-in-time, downloadable analytics and scan-data files for a chosen set of QR Codes, folders, tags, categories, or users and a chosen date range. It’s the one-off counterpart to Email reports, which delivers reports on a recurring schedule instead of on demand.
Reports is only shown in the sidebar for accounts with export permission (Pro plans and above).
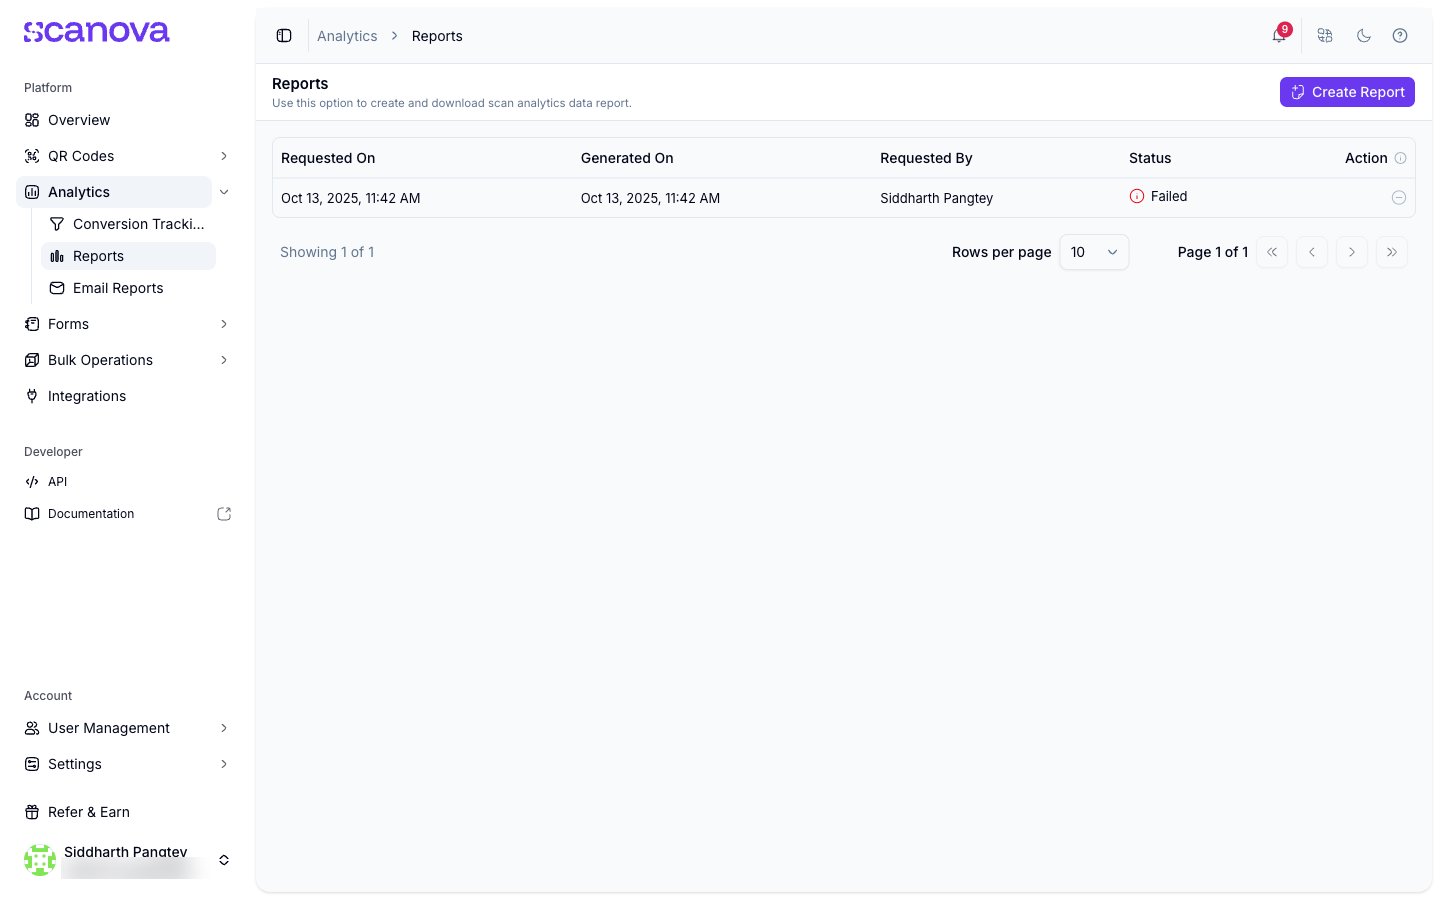
The Reports page, showing a past report that ended in a Failed status
From Analytics > Reports, select Create Report. This opens a drawer where you configure the report.
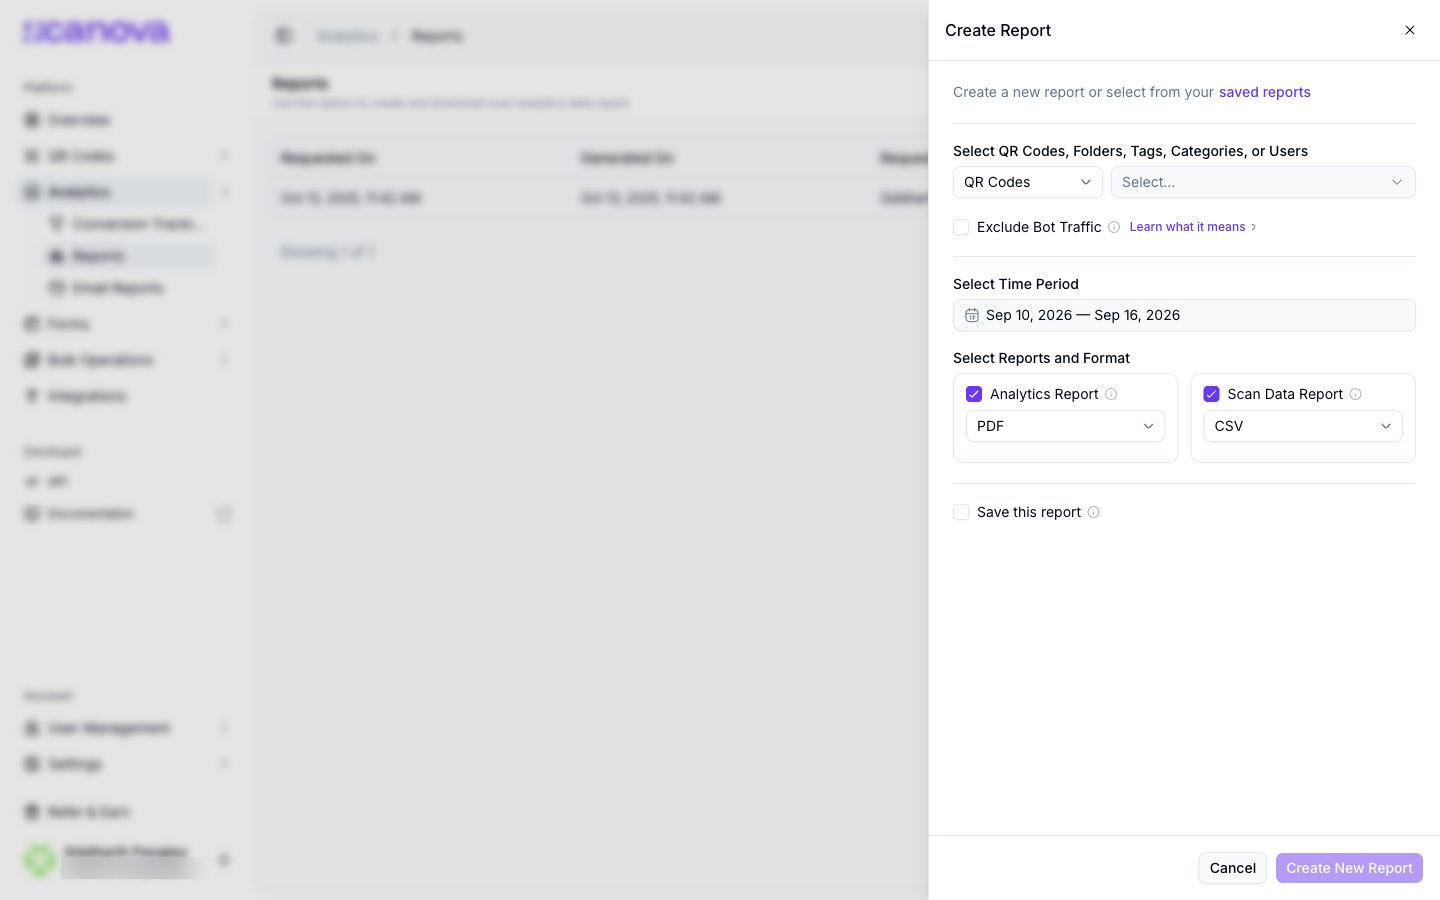
The Create Report drawer
2
Select what the report covers
Under Select QR Codes, Folders, Tags, Categories or Users, choose the entity type from the dropdown, then select the specific items (or Select all) in View/Edit Selection. Optionally check Exclude Bot Traffic to filter out non-human scans.
3
Set the time period
Select Select Time Period to open a date-range picker and choose the start and end dates the report should cover.
4
Choose report types and formats
Under Select Reports and Format, you can request either or both of:
Analytics Report — a visual summary, exportable as PDF, XLS, or XLSX
Scan Data Report — the underlying scan records, exportable as CSV, XLS, or XLSX
Each has its own format dropdown, so you can request an Analytics Report as PDF and a Scan Data Report as CSV in the same request. Both checkboxes are checked by default (Analytics Report as PDF, Scan Data Report as CSV) — uncheck either one if you only need the other.
5
Optionally save the configuration
Check Save this report to keep this combination of entities, filters, and formats so you can re-run it later without re-entering everything — saved configurations appear under saved reports, accessible from a link at the top of the drawer via a Select saved reports dropdown.
6
Create the report
Select Create New Report. The drawer closes and a new row appears in the Reports table with a Requested On timestamp and a Status of In Progress.
Requested reports are tracked in a table with these columns:
Requested On — when you submitted the request
Generated On — when the report finished processing (shown as — while still generating)
Requested By — the user who requested it
Status — a progress indicator: In Progress, then either Ready/Completed or Failed
Action — where you’d download the finished file, or cancel a pending request
A report that covers every QR Code on a large account can take a long while to build. Narrowing the entity selection returns a file sooner.
Requesting the Reports flow from the Analytics dashboard’s own “selection too large to display” prompt (its Create Report button) navigates here (to /analytics/reports?create=1) and opens this same Create Report drawer — but your entity selection and date range are not carried over. The drawer opens with an empty entity picker and defaults to the last 7 days, so you’ll need to re-select everything.